Grouping Catagories
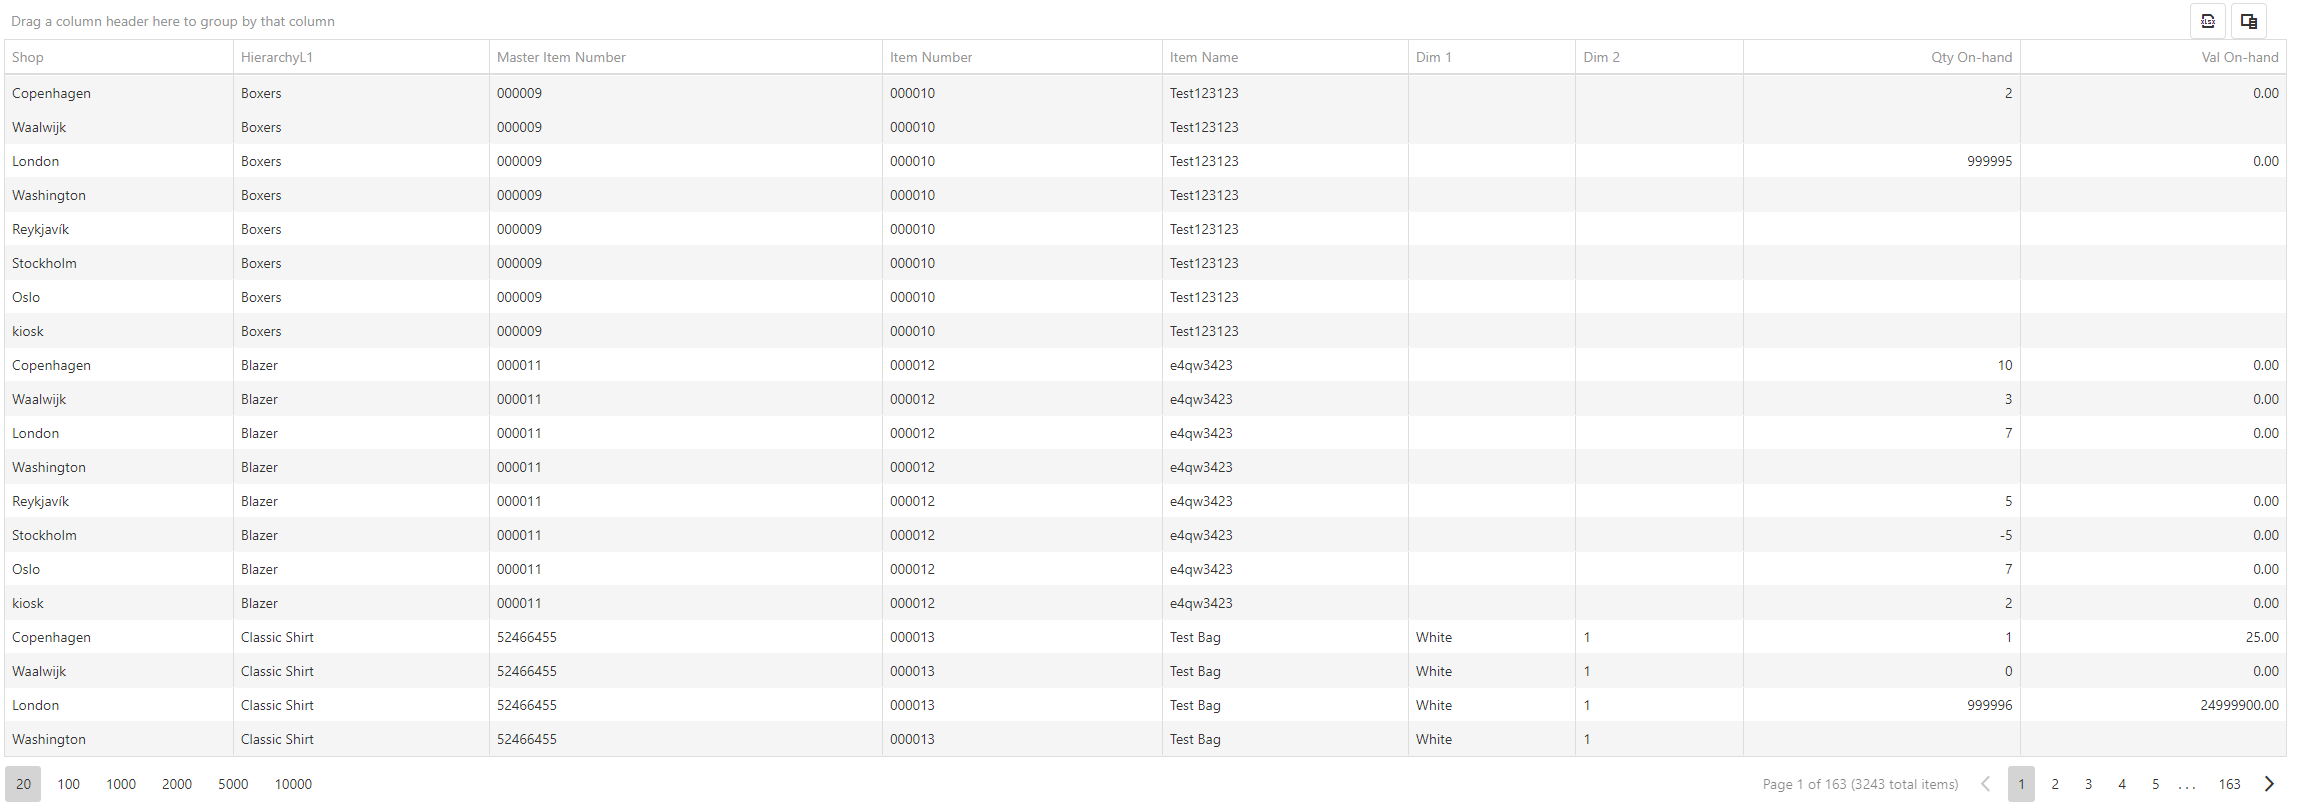
The example below shows columns with generated data without Grouping.

To generate a select number of columns for data you must use the Group by Columns.
Choose a selected number from the drop-down for example 1,2 this will then generate data for the first and second columns.
Depending on what category of data you require you can rearrange the columns by dragging and dropping them into place.

![]() If a Column Header is not visible in the Item Data Performance Table use the Column Chooser button to select and deselect different Headers.
If a Column Header is not visible in the Item Data Performance Table use the Column Chooser button to select and deselect different Headers.
![]() If you change the number of Columns you do not need to resubmit the form. It will automatically update.
If you change the number of Columns you do not need to resubmit the form. It will automatically update.
To begin creating a group choose which header you want to group by, in this example it’s SHOP.
Click and hold the Shop header and drag it into place. Depending on how many columns you have selected from the Column Group Count you will only be able to drag and drop the selected amount.
To remove a column drag it from its position into the table where you would like it to be placed.
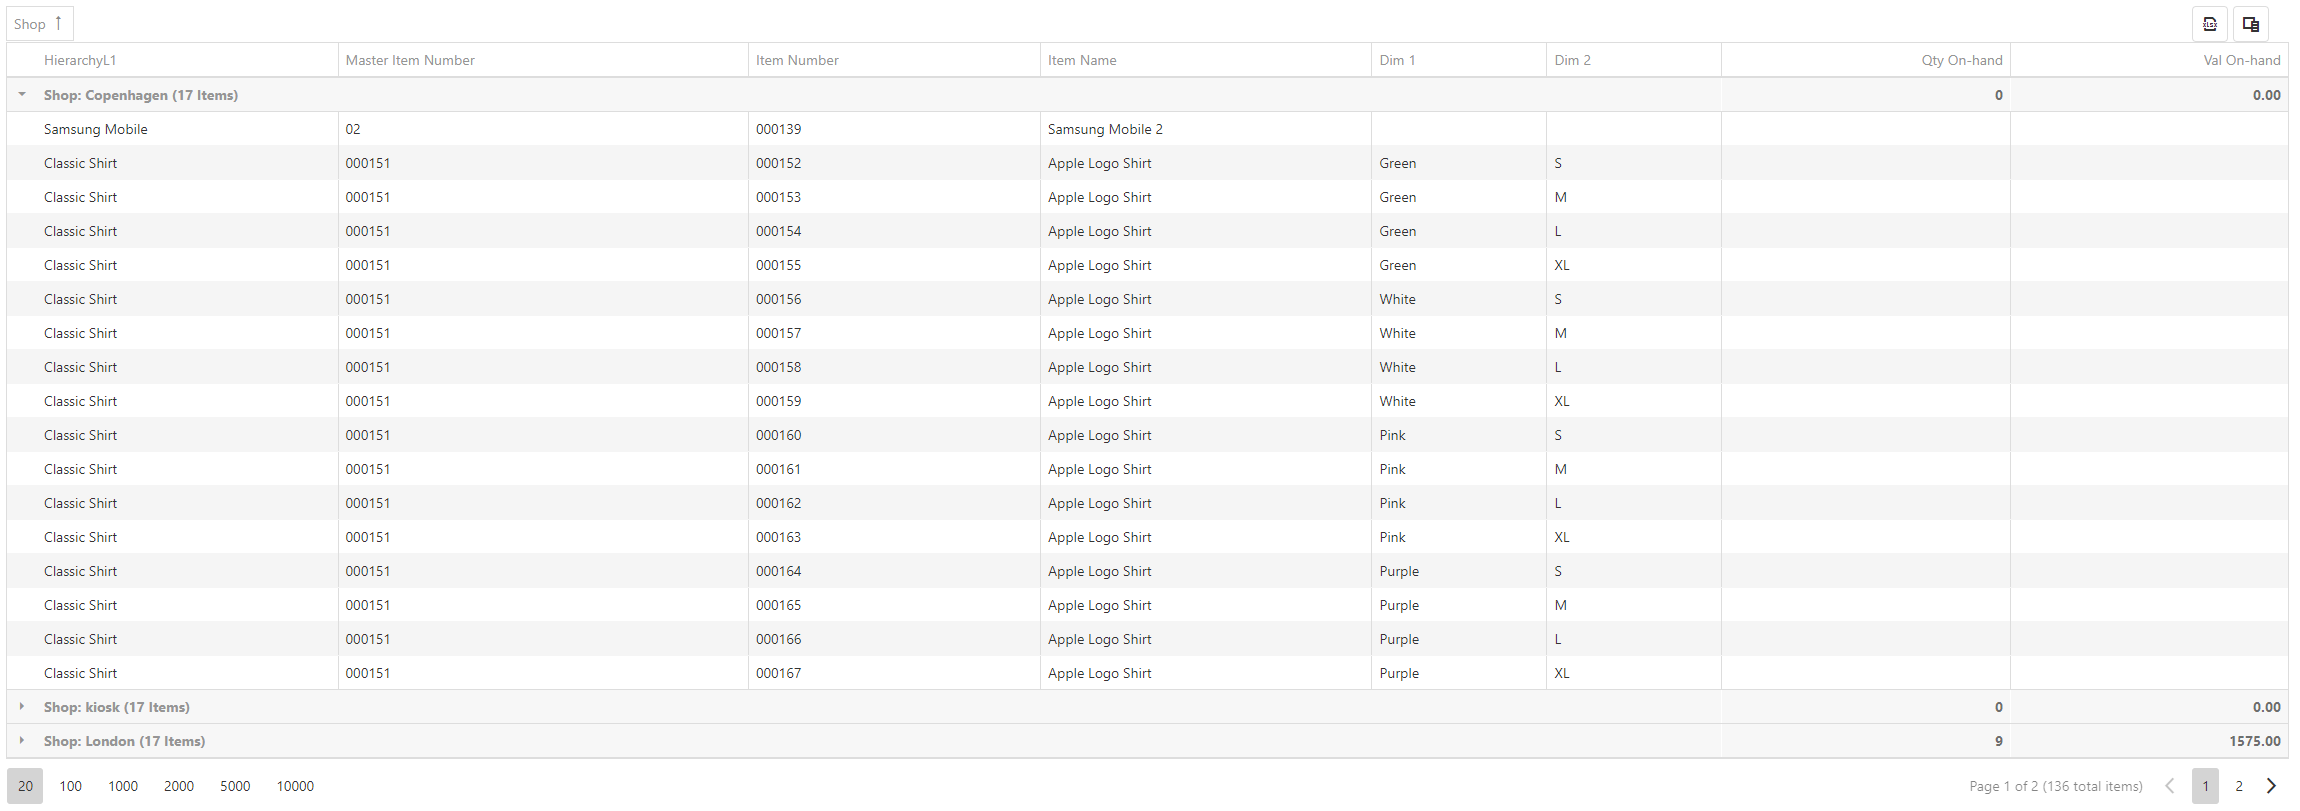
Example of 1 Column Group Count.

The Item Data Performance Table will now show differently, it is now in the group view.
Now grouped by Shops you can use the arrow![]() next to the shops name to drop down more information.
next to the shops name to drop down more information.

If you choose more than one grouping you will then have a stack of groups.
As shown below you will for example have Shops as the top filter then within shops you will have Dim 1.
To change the hierarchy of the data the required column should be first. The data will always stack in the order you arrange the groups above.
